Using Javascript to plot lines between coordinates on a canvas.
I attended Kyan’s awesome WXG yesterday, in Surrey. A one day, 2 track conference catering for both designers and developers. This was its second year in operation and also the second time I’ve been. Stand out talks came from the likes of: Seb Lee-Delisle (@seb_ly) and Gavin Strange (@jamfactory), both of which inspired me to just tinker a bit more and publish stuff, no matter how small or insignificant; not that any of the work either of those two are doing is insignificant. One of Seb’s projects that particularly inspired me was his ‘Lunar Trails’ project.
Anyway, I’ve been doing a lot of thinking lately about the data I interact with on a daily basis and how various elements of it could be used to generate ‘art’, completely different to the form it was intended/designed for.
The obvious source of data I keep getting hung up on are tweets and in particular their origins - the geolocation data.
So my first thought was, could I create a print that was based on the origins of people’s tweets from my stream. i.e could I draw a line on an HTML canvas from one set of coordinates to another, and what would that look like.
So I loaded up JSfiddle and had a little play. I didn’t want to get hung up on pulling in real time data from Twitter for the time being so I set about auto generating a number of random coordinates just using JavaScript - well my favourite flavour of JavaScript, CoffeeScript.
Seemed straight forward enough…
    genCoords = ->
      coords =
        x: Math.random() * 500 +25
        y: Math.random() * 500 +50
      return coords
This was based on the idea that i’d have an 700x700 canvas so i wanted all my coordinates to easily fit within that.
I figured straight lines between points would be kind of sharp and ugly, so immediately turned my attentions to curves or arcs. As it is, it turns out drawing smooth curves from one set of x:y coordinates to another is quite hard to do and requires quite a lot of maths, so I diverted my attention to KineticJS (this was just an experiment remember). As I hoped, Kinetic provides a far more useable method: Kinetic.Spline, for achieving the arc I was looking for.
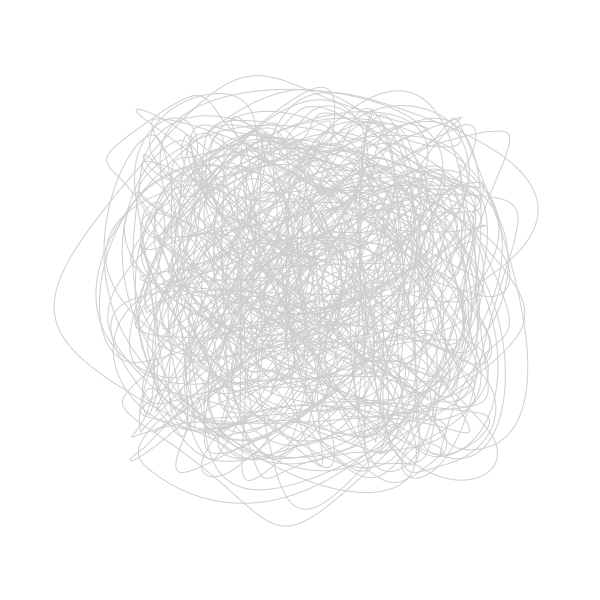
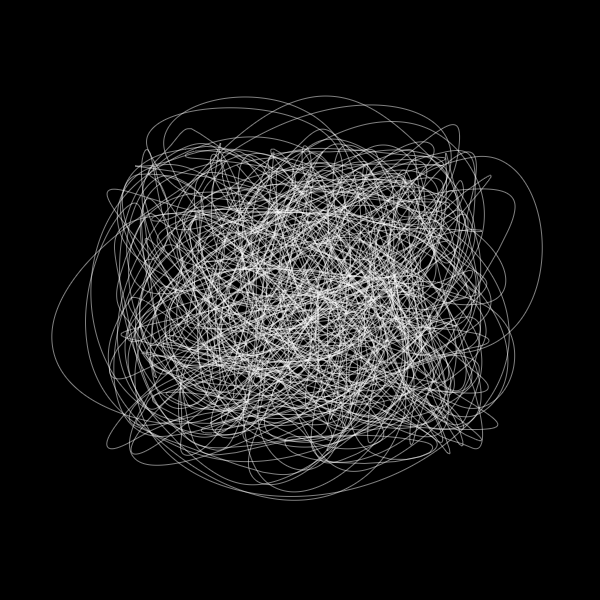
So here it is, 500 random coordinates connected to one another via lines…
    stage = new Kinetic.Stage
        container: 'container'
        width: 600
        height: 500

    layer = new Kinetic.Layer()
    splines = []

    genCoords = ->
      coords =
        x: Math.random() * 350
        y: Math.random() * 300 +50
      return coords

    draw = ->
      points = []
      if firstCoords
        points.push firstCoords
      else
        points.push genCoords()

      for x in [1..500]
        do (x) ->
          points.push genCoords()

      spline = new Kinetic.Spline
        x: 100
        y: 50
        points: points
        stroke: '#fff'
        strokeWidth: 0.5
        tension: 1

      splines.push spline

      firstCoords =
        x: points[2].x
        y: points[2].y

      # Add to layer
      layer.add(spline)
      stage.add(layer)

    draw()
And a couple of examples of what it looks like…


Now, it looks like a bit of a mess but i love the fact that the whole thing is focused around this 700x700 frame i’ve created for it, even though a lot of the lines escape the boundaries.
Next step for this experiment will be to pull in some real coordinates. Watch this space…